
Bowtie analysis is a powerful visual risk assessment tool that has gained significant popularity across many industries for its ability to clearly illustrate and communicate complex risk scenarios. This risk analysis visualisation tool provides a comprehensive overview of potential hazards, their causes, consequences, and the controls in place to prevent or mitigate them.
Many GRC platforms offer bowtie analysis as part of their library of reporting outputs. These platforms facilitate the collection of the necessary data to generate a bowtie analysis – including risks and their causes, likely consequences and the preventative controls – enabling users to download instant bowtie analysis diagrams.
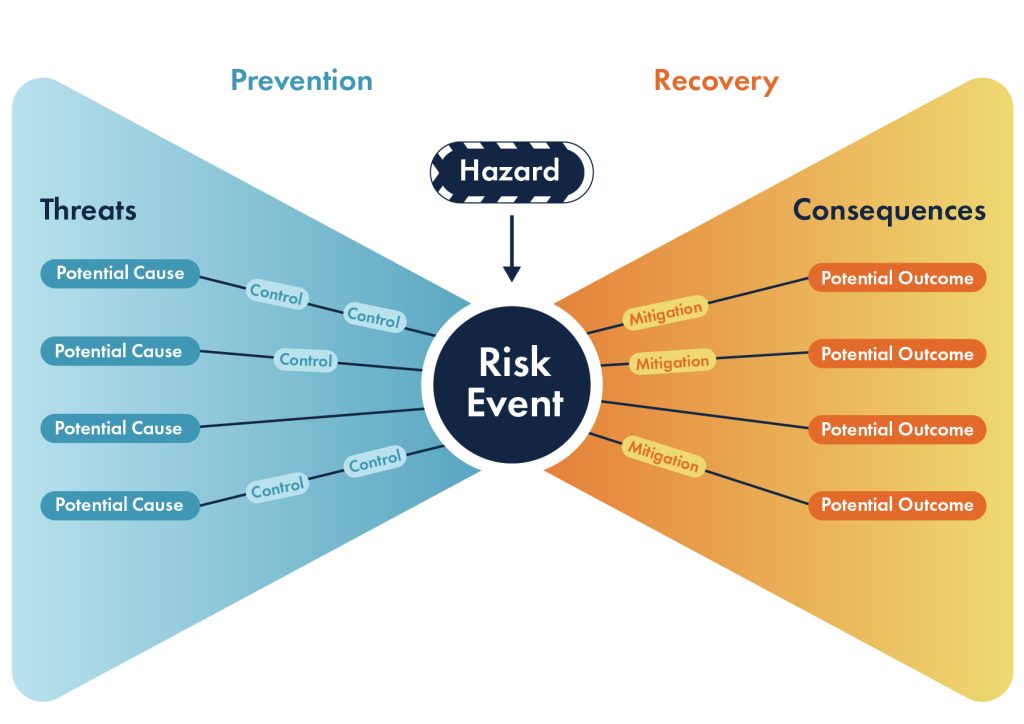
The Structure of a Bowtie Diagram
The bowtie diagram gets its name from its distinctive shape, resembling a bow tie. At the middle of the diagram is the “knot,” which represents the hazard or main risk event. The left side focuses on potential causes and threats that could lead to the risk event and any preventive measures or controls implemented. The right side illustrates the impact and consequences of the risk event and highlights mitigating measures & controls to reduce the impact.
Key Benefits of Bowtie Analysis
Using bowtie analysis diagrams to analyse risk exposure, consequences and preventative measures & controls provides a wealth of benefits for organisations.
- Visual Clarity: The bowtie method provides a clear, easy-to-understand visual representation of risk scenarios, making it accessible to both specialists and non-specialists.
- Comprehensive Risk Overview: Bowtie diagrams offer a systematic approach to analysing and understanding risks, helping organisations identify potential weaknesses in their ERM strategies.
- Control Assessment: The method allows for a detailed examination of controls and preventative measures, highlighting their effectiveness and any potential vulnerabilities.
- Drives Action: By clearly identifying preventive and mitigative measures, bowtie diagrams ensure accountability and help prioritise actions.
- Decision Support: By providing a structured view of risks, bowtie analysis supports proactive risk-based decision-making, helping organisations allocate resources & budgets effectively to reduce the most critical risks.
- Building a Risk Aware Culture: The visual nature of bowtie diagrams makes them excellent for communicating risk management strategies & issues across different levels of an organisation – from operational staff to the board.
Applications Across Industries
While the bowtie method originated in the oil and gas industry, it has been adopted by various sectors, including aviation, mining, maritime, chemical, financial services, and healthcare. Its versatility allows it to be applied not only to safety risks but also to environmental, financial, reputational, and operational risks.
Creating a Bowtie Analysis
When you are not using a GRC software platform, developing a bowtie analysis typically involves organising a multidisciplinary workshop where participants collaborate to identify potential threats, consequences, and control measures. This traditional collaborative approach ensures a comprehensive assessment of the risk scenario from various perspectives.
How does GRC software generate bowtie analysis diagrams?
GRC software generates bowtie analysis diagrams by leveraging API integrations and automated data aggregation to pull relevant risk information from various sources within an organisation.
The software collects data from multiple systems and databases across the organisation, including incident management systems, risk registers, and control frameworks. The GRC platform automatically identifies and maps relationships between risks, causes, consequences, and controls based on the collected data. Using the mapped relationships, the software automatically generates the bowtie diagram, placing the hazard or top event at the centre, threats and controls on the left, and mitigating actions and consequences on the right. The software can receive real-time updates on threats, vulnerabilities, and control effectiveness, allowing for dynamic updating of the bowtie diagram.
By automating this process, GRC software eliminates the need for manual data entry and diagram creation, making it easier for organisations to integrate bowtie analysis into their risk management programs and engage a wider audience in risk management collaboration.
Why should you use bowtie analysis in your risk management program?
Bowtie analysis stands out as a valuable data visualisation tool for risk managers and their stakeholders. Its ability to provide a structured, visual representation of complex risk scenarios makes it an essential method for organisations seeking to enhance their risk assessment process and gain greater risk oversight. By clearly illustrating the relationships between hazards, causes, consequences, and control measures, bowtie analysis enables organisations to develop more robust and effective risk management strategies.
As industries continue to face evolving risks, the bowtie method’s adaptability and clarity make it an indispensable approach for modern risk management programs. Its widespread adoption across various sectors underscores its effectiveness in helping organisations navigate the complex landscape of risk assessment and risk mitigation.
To learn more about how the Camms platform can automate your risk management program and to see how our bowtie visualisations can provide deep insights into risks and their consequences, request a demo.


 Risk Management
 Compliance Management
 Policy Management
 Project Risk Management
 Cyber & IT Risk Management
 Third-Party Risk Management
 Audit Management
 Environmental, Social & Governance (ESG)
 Internal Controls
 Business Strategy
 Business Continuity Management
 Operational Resilience
 Crisis Management
 Threat Intelligence
 Emergency Notification
 Risk Management Information System (RMIS)
 Claims Management Software
 Health & Safety Software
 Portfolio, Programme & Project Management
 Workplace Health & Safety
 Incident & Event Reporting
 Registers & Workflows
 Reporting
 Dashboards
 Integrations
 Aerospace & Defence
 Aged Care
 Education
 Energy & Utilities
 Financial Services
 Gambling & Gaming
 Government
 Healthcare
 Insurance
 Legal
Legal Manufacturing & Construction
 Mining & Metals
 Non-profit
 Pharmaceuticals
 Retail
 Telecommunications
 About
About Leadership
 Our Partner Network
 Careers
 Customers
 News & Events
 Blog
Blog Ebooks & Reports
 Webinars
 Content Collections
 RFP & Business Case Templates