Why does my organisation need a Risk Management Dashboard?
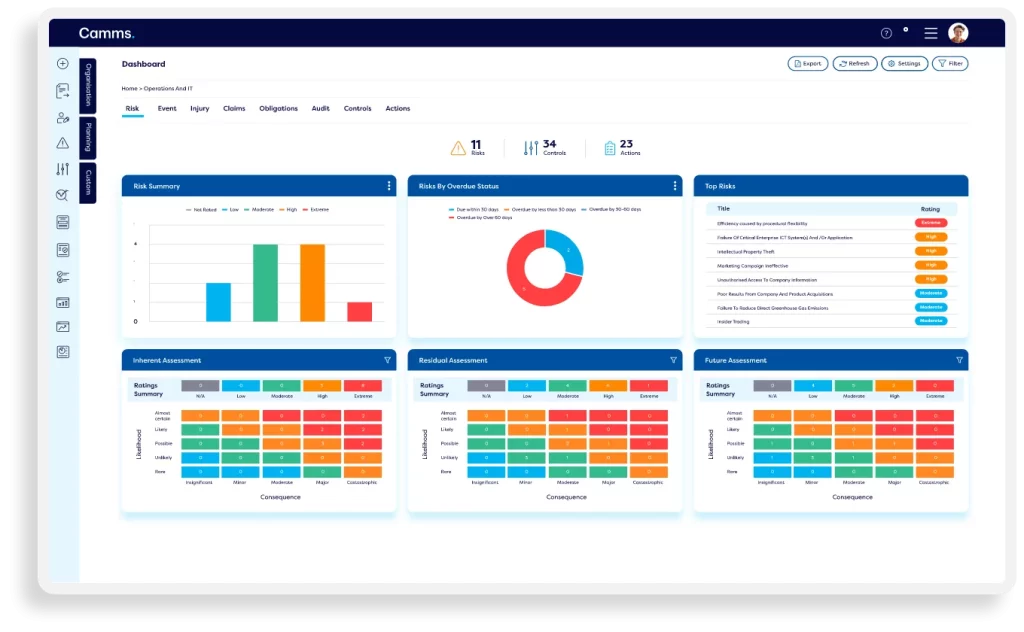
A comprehensive risk management dashboard provides an organisation with a holistic view of risk based on likelihood, impact, and severity. GRC software delivers a range of interactive risk dashboards straight out-of-the-box to provide invaluable data & insights.
Personalized
Camms risk management software offers a range of personalized risk management dashboard layouts that can be tailored to suit each role in your organisation.
Interactive
The risk management dashboards in the Camms platform enable employees of all levels to easily view key risk metrics and complete their risk related tasks online.
Always up-to-date
The risk management dashboards within our GRC platform seamlessly update in real-time ensuring instant access to current risk data and insights making it easy to identify, analyze, and manage risk.
What risk data and key metrics will each employee see in their risk management dashboard?
- Risk Professionals
- Operational Employees
- Management
- Directors & Board Members

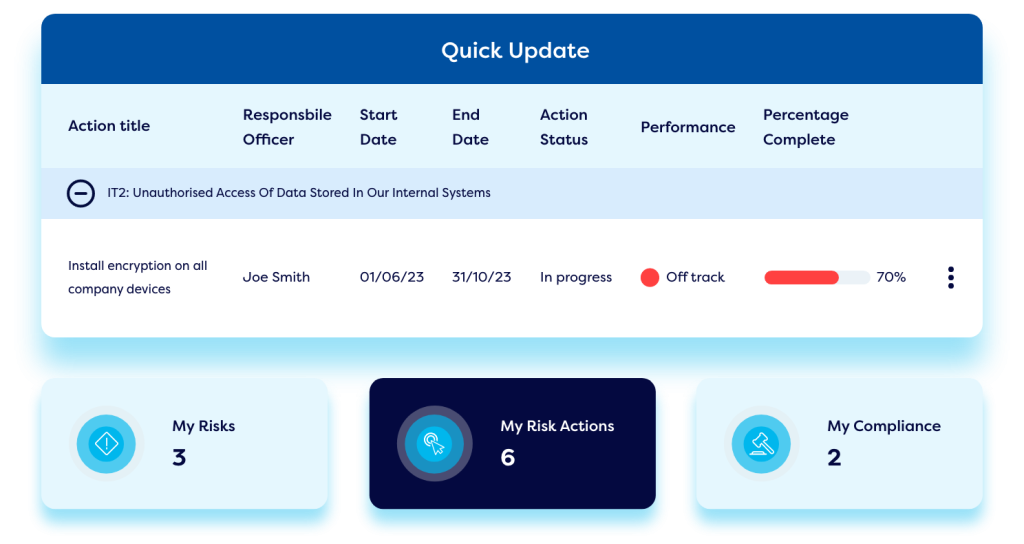
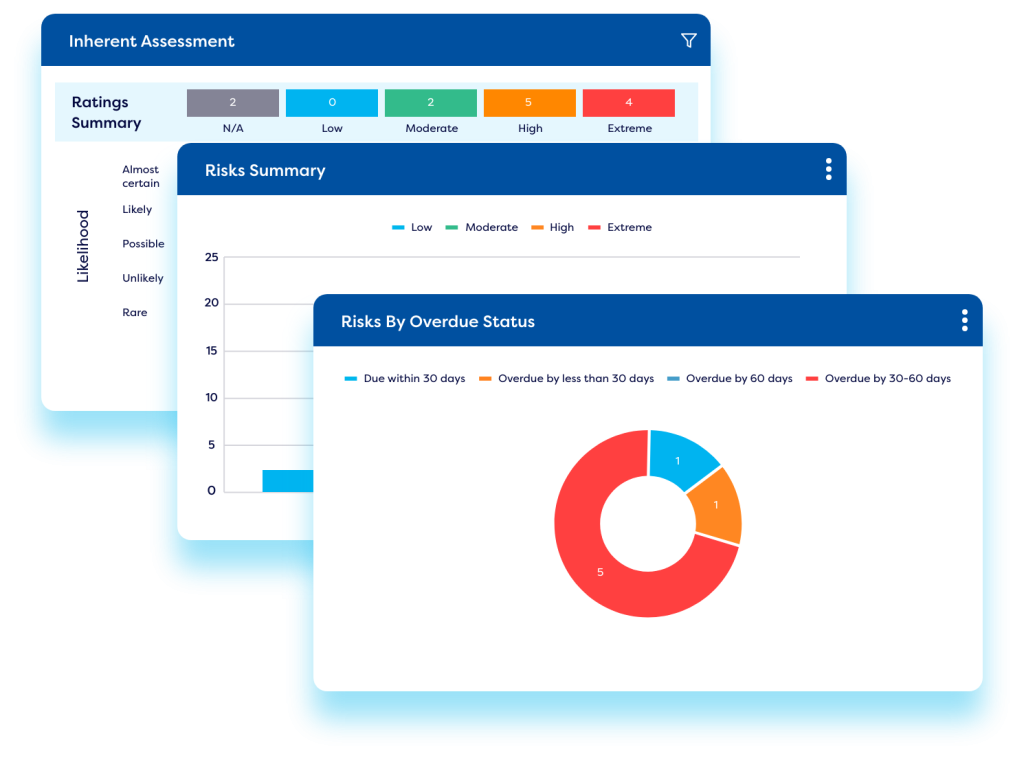
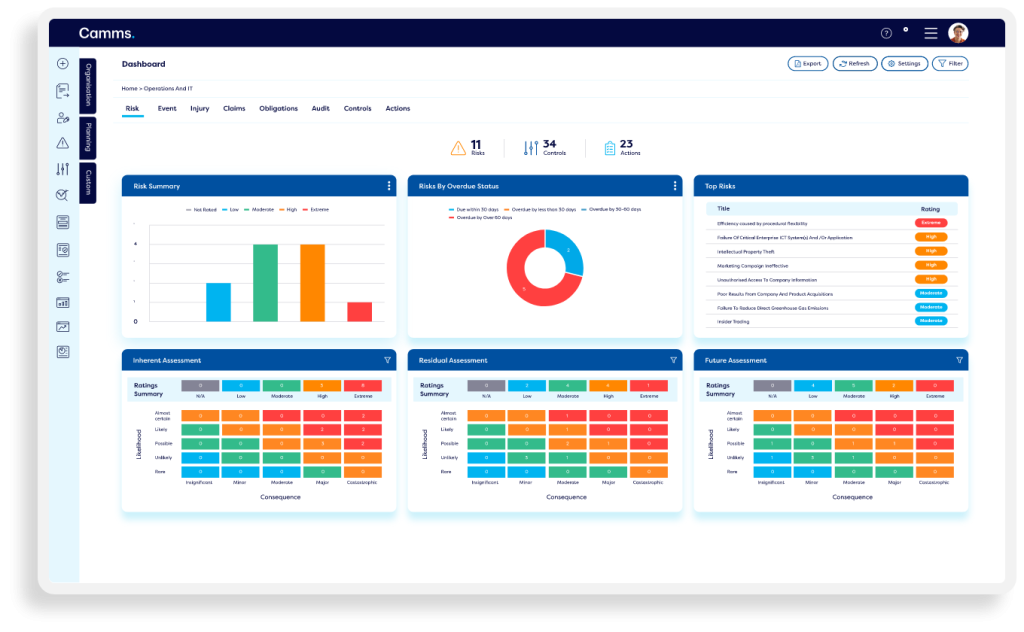
Detailed risk management dashboards offer risk teams and risk managers a summary of all operational risk and cyber risk management activities based on the risk register or risk log and the relevant risk scores. Risk professionals can access a view of the entire risk register including heat maps & bowtie visualizations – indicating areas that have reached their risk tolerance. Risk dashboards will further summarize any outstanding actions on risk related tasks from across the enterprise which must be addressed.
Risk management dashboards will show operational workers a list of their outstanding tasks relating to risk assessments, control testing, and regular checks that need to be carried out so they can be completed within the GRC platform. Low-level stats will highlight any overdue actions and tasks and summarize key risk metrics.
Professionals that oversee a departments, teams, or specific business areas will have their own unique layout for their risk management dashboards and have to data that shows an overview of risk exposure and project risk in their team. This includes a summary of overdue actions in their area, and a list of actions relating to risk escalations & approvals for which they are responsible – supporting agile decision making.
The risk management dashboards for directors or boards will display a summary of risk across the entire organisation – enabling them to address high risk areas and allocate budget & resources to reduce the most critical risks.
What information should a Risk Management Dashboard provide?
Our GRC software offers a variety of risk management dashboards tailored to the level and role of each employee in your organisation creating an infographic summary of risk. Here are a few examples of what type of information a risk management assistance dashboard should include:
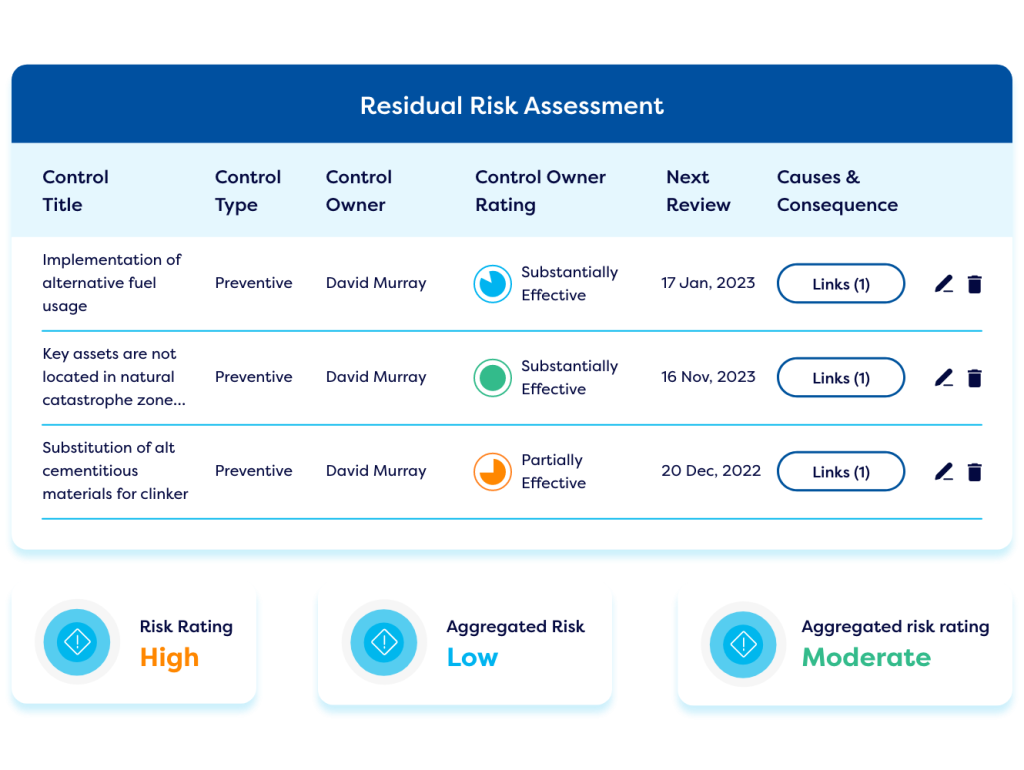
Overview of risk assessment & checks
Operational employees are routinely tasked with completing regular risk assessments & control checks to understand control performance. Risk management dashboards will detail any upcoming or outstanding actions. Risk professionals and managers will be able to view the completion status and results of risk assessments & checks enabling them to use the data to make informed decisions.
Notifications & alerts
Risk management dashboards summarize real-time data and use notification to highlight important tasks, upcoming events & deadlines, or changes in risk status – enabling users to stay up-to-date and take timely action as needed within the GRC platform.

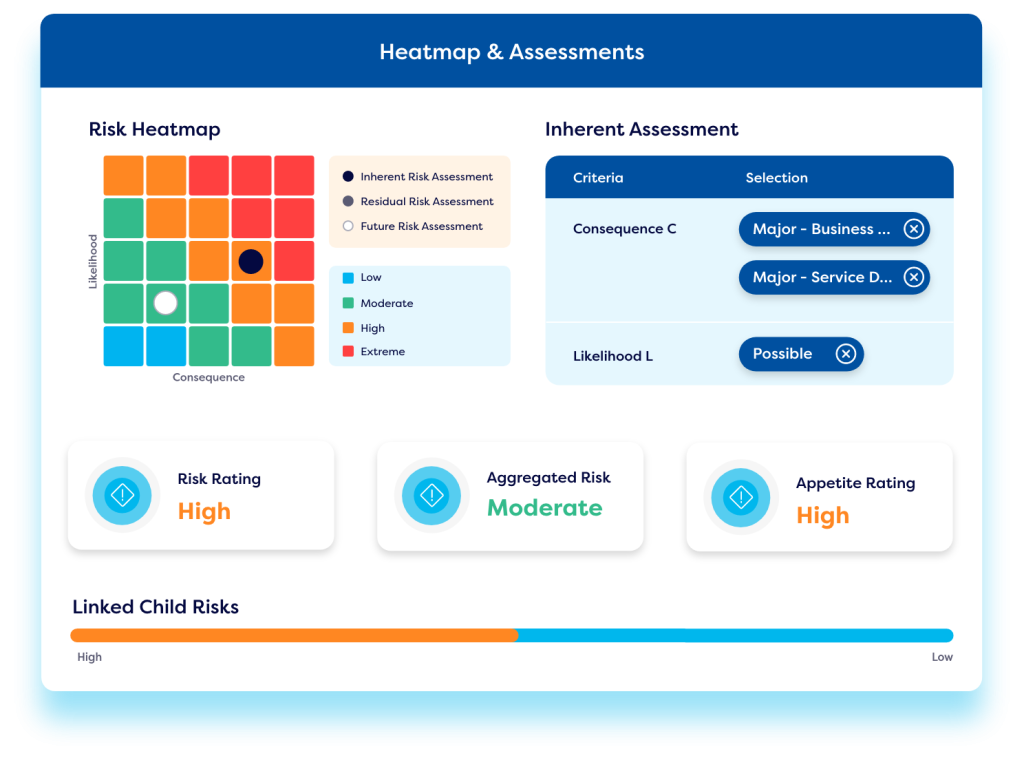
Control effectiveness & control testing reports
Most risk management dashboards will contain data regarding control effectiveness & control checks. Operational staff will get a simple view of any control checks and testing tasks that are pending. Management will get an overview of control effectiveness and control status across their departments & teams, and risk professionals will get a holistic view of control effectiveness across the entire enterprise enabling them to suggest improvements in problem areas.
Summary of risk exposure
For senior team members, risk professionals, and board executives most risk management dashboards will offer a clear summary of the risk register, highlighting key focus areas and topics using graphs, pie charts, and data visualization tools. Many dashboards in GRC software are interactive and enable users to drill down into problem areas and conduct investigations and understand the financial impact of key risk areas across enterprise risk, operational risk, strategic risk, ESG risk and enterprise cyber risk. Stakeholders can access charts or graphs showing trends and patterns in risk data over time showing the status of Key Performance indicators KPI’s.
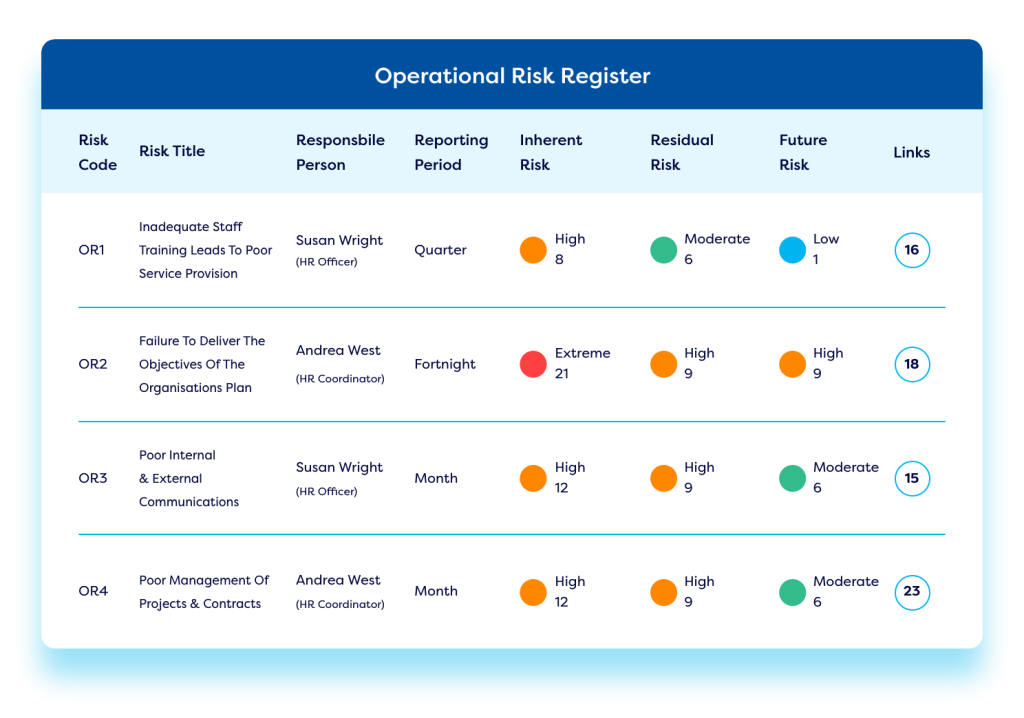

Performance against KRI’s
Risk mitigation activities
Most risk management dashboards provide an overview of current risk mitigation initiatives, encompassing action plans, risk treatment methods, and progress reports. These tools enable users to track the status of risk mitigation activities and verify that controls are being applied effectively.

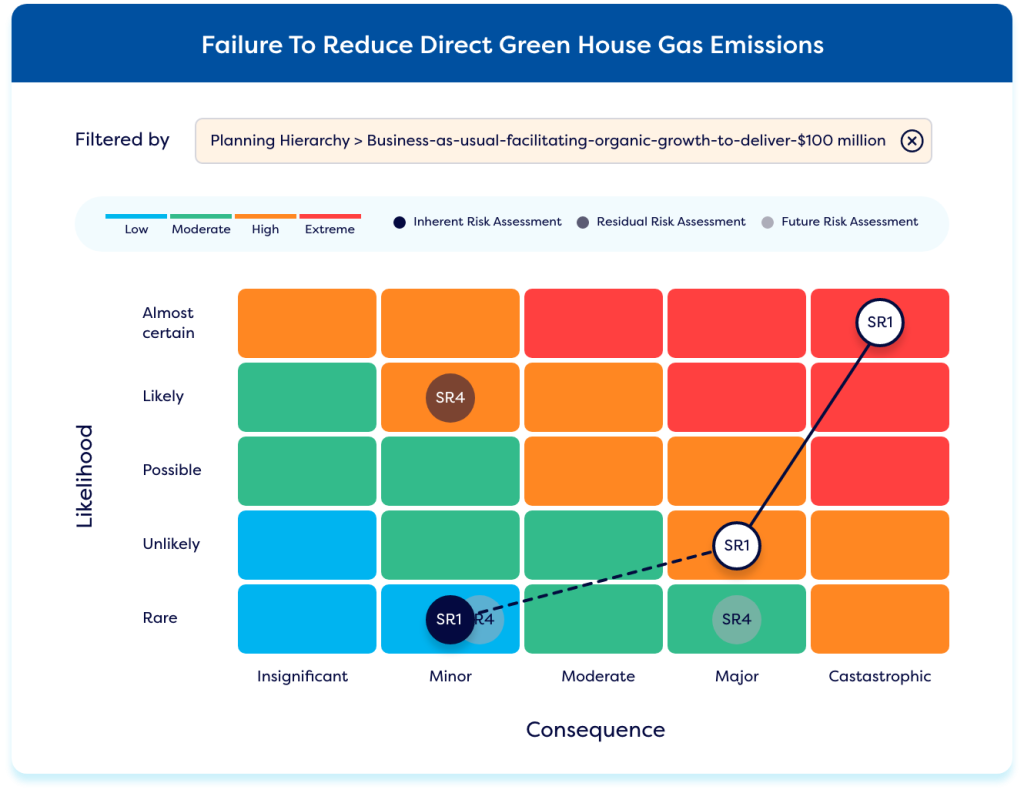
Heat map reports
Risk assessment dashboards tend to offer a variety of heat map reports for simple risk analysis. Via these visual representations of risk, stakeholders can quickly assess and prioritize areas of concern. Color-coding indicates the severity, likelihood, or impact of risks, and highlights control effectiveness, compliance status, and other key metrics.
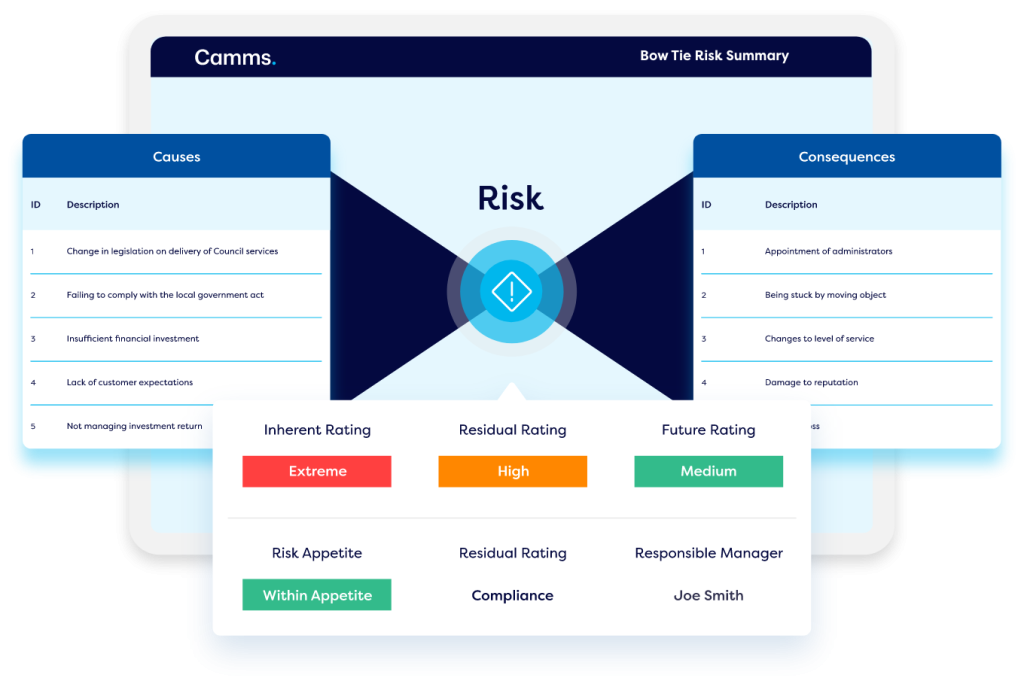
Bow-tie visualizations
The dashboards in our GRC platform feature bow-tie visualizations – offering a structured framework for identifying, analyzing, and mitigating risks. This is especially useful for risks with significant consequences or potential impacts on safety, operations, or compliance. These visualizations are a valuable addition to risk management dashboards for both risk teams and executives.
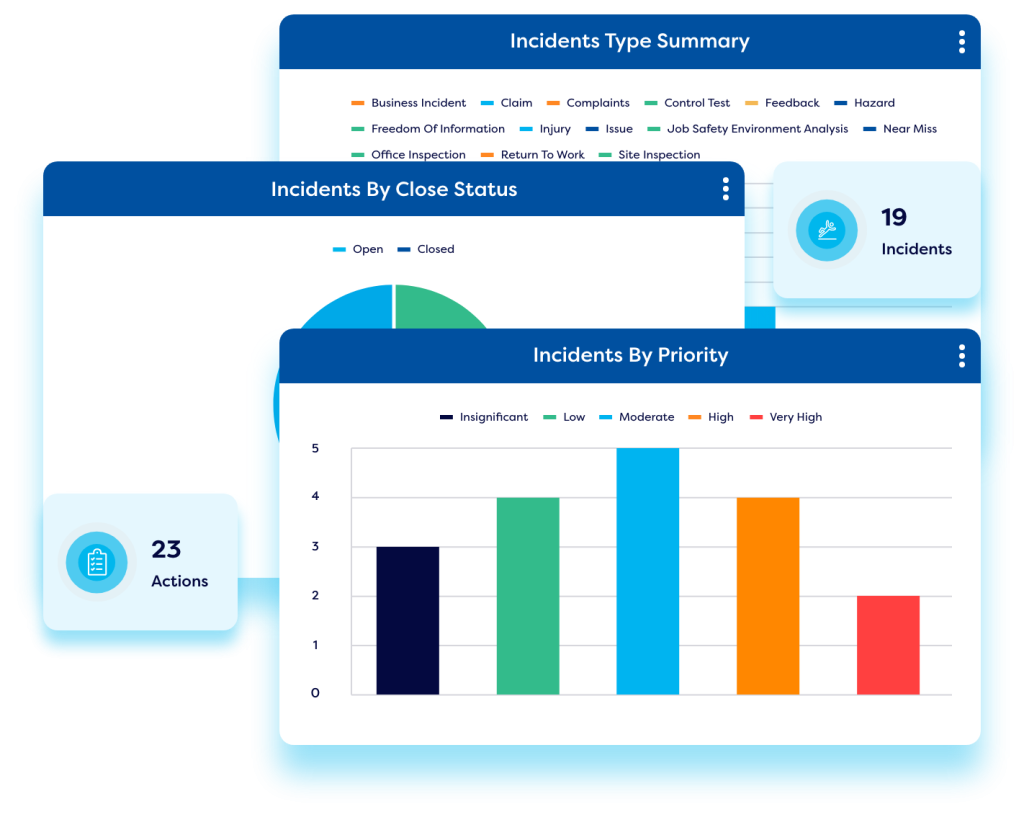
Incidents status reports
Rising incident rates is a clear indicator that risk levels are high and need to be addressed. Therefore, many risk dashboards offer a high-level overview of reported incidents enabling teams to drill down and investigate problems.
Why Choose Camms for Risk Management Dashboards?
Data security & privacy
SOC Type 1 & 2, ISO 27001, and Cyber Essentials certified, our risk dashboards are safe and highly secure. A complex permissions hierarchy ensures each user’s ‘risk dashboard’ only display risk data and insights relevant to their role and responsibilities and offers activity explorer features to keep a record of each employees’ activity in the platform.
Discover more about the GRC platform behind our
Risk Management Dashboards
Resources relating to Risk Management Dashboards
The latest and hottest pieces of risk management dashboard related content to keep you in the loop.

A Simple Guide to Choosing the Right Risk Management Software
This blog will discuss must-have features in risk management software and support you to choose the right platform for your organisation.
8 Surefire Ways to Improve Your Risk Management Program
This whitepaper highlights the importance of adequate risk reporting to guide decision-making, identify risk exposure, and uncover control inefficiencies and explains how to get a complete view of risk across your organisation.
From Excel to Excellence: Turning Your Risk Data into Insights & Decisions
In this eBook, we explore why spreadsheets are outdated for risk management and help you to identify if your business is ready to swap spreadsheets for an automated GRC solution. Plus, we detail the top 10 reasons to switch from spreadsheets to software.
Frequently asked questions about
Enterprise Risk Management Dashboards
What are the main factors to take into account when choosing a GRC platform that generates risk management dashboards?
When selecting an GRC tool, firms must consider who will be using the platform and what data outputs they need to extract and view in their risk management dashboard.
When scoping out requirements for solutions with risk management dashboards firms must consider:
- Which framework will they use to rate and categorize risk.
- Can the risk management tool be configured to meet any bespoke dashboarding requirements?
- Can the tool expand with the organisation and provide more functionality as the risk management program grows?
- Is the platform secure and what cyber security measures does it have?
- Does the GRC platform talk to your other systems and data sources via API Integrations to pull reliable risk data into your risk management kpi dashboard?
- Who needs to access the risk dashboards in the GRC software and what data will they enter and what reports & metrics do they need to view in their dashboard and report on?
- Does the software offer risk dashboards with bow tie visualizations and heat maps?
- Does the platform offer customised templates for operational risk assessments and visualization dashboards?
- Does the GRC platform enable you to implement insider risk management through policy setting and controls to meet your unique business needs
- Does the platform offer cyber risk management and can it be used to create cyber risk dashboards?
The benefits of adopting a risk management platform with a risk dashboard include:
- Reduced time spent on reporting and admin.
- Risk dashboards provide a consolidated view of ERM and op risk across the entire organisation providing risk severity level scoring.
- Risk management dashboards enable everyone in the organisation to feed into the risk management process as part of everyday operations – creating comprehensive risk data to guide decision-making.
- Risk management KPI dashboards generate better visibility of an organisations risk profile and risk exposure.
- Heightened visibility through risk dashboards offers a drop in risk monitoring and reporting costs.
- The risk dashboards within integrated risk management platforms enhance an organisations risk management approach by empowering firms to link risk to enterprise performance and long-term strategic objectives.
- GRC platforms with risk management dashboards offer good business governance enabling firms to operate in line with key risk management standards like ISO 31000 and other industry best-practices – identifying and mitigating potential security flaws.
- Risk management dashboards act as an early warning system for business compliance and help to visualize compliance risk.
- Best-practice risk management with informative risk management dashboards can improve company performance and sustainability and detect potential vulnerabilities in real time.
- Risk management dashboards allow for benchmarking of business units enabling leads to identify & address poorly performing sites and work towards continuous improvement.
- Choose a risk management software that is highly configurable as it will reduce costly professional services fees.
- Choose a GRC tool with unlimited risk registers, types, and categories -to easily segment risk data ensuring your risk dashboards provide deeper insights into specific risk areas.
- Select a risk platform that offers instant reports and real-time risk dashboards that can be customised to suit your internal requirements.
- Select a risk platform that integrates with your other systems to ensure a single source of truth for your risk data that can be visualized through risk dashboards.
- Opt for an integrated GRC platform that offers other GRC functionality like governance, compliance, ESG and incident reporting – it is beneficial to manage these areas in the same platform and integrate the data for more in depth reporting and risk management dashboards.
- Poor quality operational risk management data stemming from the absence of data governance rules.
- Managing risk data across various forms and spreadsheets results in inaccuracies and discrepancies in risk management dashboards.
- Disparate risk data scattered across spreadsheets leads to inconsistent data and inaccurate risk management dashboards, a poorly defined risk framework, and inaccurate reporting.
- Relying on manual processes without automation slows down the risk escalation and resolution processes.
- Lack of integration complicates mapping risks to associated controls and mitigation measures.
- Organisations struggle to visualize and compare risks holistically across different sites, departments, and countries due to siloed data, inconsistent risk frameworks, and a lack of visibility.
Access our calculator to understand how much you could save in terms of cost and hours spent on managing risk if you were to implement a GRC tool with a risk dashboard. Simply enter the relevant details about your current risk management approach and our ROI calculator will provide approximate estimates on the potential time and money you could save by implementing a GRC software.
Discover what your risk management dashboard could look like, request a demo.
Fill out our simple form to see the Camms’ risk management dashboards in action.
